The ABAP Runtime Analysis (transaction SE30) is the best starting point if you want to execute performance or flow analysis of your ABAP program. Unfortunately many people use ABAP Runtime Analysis only to look for performance bottlenecks and don’t know that ABAP Trace is the only tool with which you can trace the execution flow of an ABAP program at the statement level. This blog will show you how to use ABAP Trace of ABAP Runtime Analysis (SE30) to follow the flow logic of your ABAP program.
1. Why analyze the flow of an ABAP program?
The ABAP Runtime Analysis (transaction SE30) gives you one tool for solving two problems. You can measure performance and find bottlenecks. You can also analyze the program flow of your ABAP program. In this blog we will focus on program flow analysis.
Why do you need to analyze the flow of ABAP program? Let me give you just a couple examples.First, you may need to find the exact source code location of a particular ABAP statement (a method call, function call…) you are interested in. You would then run the ABAP Trace and afterwards search the required line in the result list of the ABAP statements. Second, you may want to compare the flow of your ABAP program in different systems. Imagine, for example, that your ABAP program runs as expected in the test system but shows a completely differently behavior in the production system, or even worse, aborts with a short dump in the production system. You could then simply run the ABAP Trace in both test and production systems and compare the trace results.
2. How to find exact source code line of an ABAP statement?
Just imagine, you go to the ABAP Editor (transaction SE38), type “XXX” into the “Program” field, press the “Display” button and get the error message on the status bar “Program XXX does not exist”. How could you find out the exact source code line of the ABAP statement that produced the message?
You could of course start the ABAP Debugger and try to debug in single step. And then after hours or weeks of intensive debugging you might be lucky enough to find the source code line of the ABAP statement. But why waste time? Here is how to use the ABAP Runtime Analysis to find this error message in a couple of minutes.
If you press “?” button or click on the status bar near the error message, you will see the F1 help on the message, in the performance assistant. This tells informs you that the number of the error message is DS017. Therefore you have to look for the “message DS017”:
To find the message, first start the ABAP Runtime Analysis and create a measurement variant.
1. Start the ABAP Runtime Analysis (transaction SE30) via System -> Utilities -> Runtime Analysis -> → Execute or call the transaction directly with “/nse30“.
2. Type “SE38” into “Transaction” field.
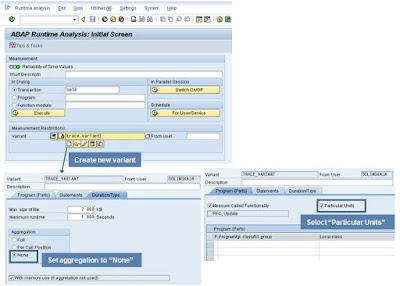
3. Create a measurement variant for your user:
- Type a name into “Variant” field and press “Create” button
- Set aggregation to “None” on the “Duration/Type” tab
- For memory usage info check the “With memory use” flag
- Switch on “Particular units” on the “Program(Parts)” tab
- Save your variant
Before we go on, some important notes.
- Don’t use aggregation if you want to trace ABAP in order to follow the program logic (what we are doing here). Aggregation summarizes the trace data for a particular type of event in a single trace record and therefore reduces the number of entries in the trace file. But to see the complete program flow you need all trace data.
- Try to use “Particular units” where possible in order to reduce trace file size and trace only the code you really need to see. The option “Particular units” allows you to switch on/off the ABAP trace during the running transaction. The trace will be started as soon as you enter “/ron” (trace on) in the OK field in your transaction. With “/roff ” the trace is stopped. Alternatively you can also use the menu path: System -> Utilities -> Runtime Analysis -> Switch On / Switch Off.
Let’s execute the measurement:
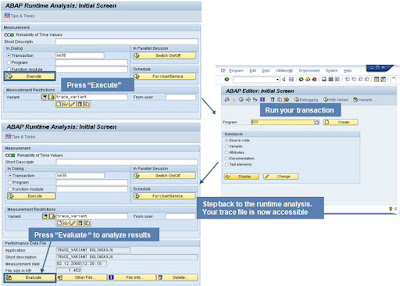
1. Press “Execute” button. Transaction SE38, the ABAP Editor, starts.
2. Type “XXX” into the “Program” field and turn on the trace with System -> Utilities -> Runtime Analysis ->Switch On.
3. Press the “Display” button and turn off the trace with System -> Utilities -> Runtime Analysis -> Switch Off.
Step back to the Runtime Analysis and analyze the trace results:
1. Press the “Evaluate” button.
2. Press the “Call Hierarchy” button and you get a list which represents the complete path through your program.
3. Search for “message DS017” in the Call Hierarchy list.
4. Double-click on the entry in the Call Hierarchy list to jump to the source code line, which initiated the error message.
3. How to trace a long running batch job?
Now imagine the following situation. You are the administrator of a production system, and you encounter in the Process Overview (transaction sm50) a batch process, which already has been running several days and has been selecting data from a database table. This process is blocking other background jobs and you have to find out what this process is actually doing:
You can find this out very easily with the ABAP Runtime Analysis. You can use the ABAP Runtime Analysis (SE30) to trace programs which are running in a parallel session.
- Ensure that you run SE30 on the same server as the running process!
- You must create or adjust a trace variant for tracing the parallel process. Set aggregation to “None” again to get the Call Hierarchy.
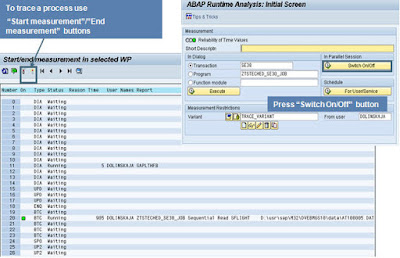
- Press the “Switch On/Off” button to trace processes running in a parallel session. The Runtime Analysis displays a list of the running processes similar to the Process Overview (transaction sm50).
- Use the “Start measurement/End measurement” buttons to activate and deactivate trace.
Caution: Deactivate the trace again after short tracing time so that you do not reach the trace file quota! Before deactivating the trace, refresh the work process display. The dialog step that was active in the work process with the activated trace may have changed, and that deactivates the trace automatically.
5. Press “Evaluate” button to analyze trace results.
4. How to trace HTTP/RFC requests or processes of other users?
There are also often situations where you need to trace HTTP or RFC requests or processes of other users. Let me give you some examples.
Imagine there is an online flight booking system. If a user wants to reserve a flight, his HTTP request arrives in your backend system. And you need to trace the reservation process which is running in your ABAP backend system. In such case you don’t know which ABAP backend process handles which HTTP request and have no idea when the HTTP request will reach your ABAP backend system. Therefore it is difficult to capture such a request for debugging in the appropriate ABAP backend process.
Another good example would be frequent RFC requests which reach your ABAP system and last only several hundred milliseconds. It is quite hard to trace such short-lived requests. Maybe you also have to deal with a batch job that runs under another user, which always starts at a different time and aborts sporadically with a short dump. How can you trace something like this?
The ABAP Runtime Analysis (SE30) provides an answer. It lets you schedule a trace for any user on the current server.
- Start ABAP Runtime Analysis (SE30).
- Create your trace variant and set aggregation to “None” again to get the Call Hierarchy.
- Press “For User/Service” button in the “Schedule” area of the initial screen.
- Press “Schedule measurement” button on the Overview of Scheduled Measurements screen.
The transaction presents a popup on which you can schedule an asynchronous trace according to these criteria:
- User
- Client
- External session (choose “Any” if you are not sure in which session the application will run!)
- Process Category (dialog, batch, RFC, HTTP, ITS, etc.)
- Object Type (transaction, report, function module, any, etc.)
- Object (e.g. only transaction se38)
- Max. No. of sched. Measurements (specify the maximum number of traces)
- Expiration Date and Time (specify the time frame when the trace shall be active)
When the trace is scheduled, the ABAP Runtime Analysis automatically starts the trace as soon as session that meets your criteria is started on the system. The user you have specified logs on to the system and executes his task, and the ABAP Runtime Analysis starts to write the trace. The trace results can be analyzed – as usual – in the ABAP Runtime Analysis (using the “Evaluate” button on initial screen).


No comments:
Post a Comment