SAP NetWeaver 7.0 EHP2 brings an expanded set of breakpoint and watchpoint capabilities as well as a new higher-resolution statement debugging capability (of course in the New ABAP Debugger!).
This blog shows how to use these new features:
If you are interested in a live demonstration of the new features in ABAP breakpoints and watchpoints, just take a look at this short video:
This blog shows how to use these new features:
- The new types of breakpoint (on ABAP command, on Web Dynpro entities, on method of a class, on Simple Transformations…)
- The new types of watchpoints (on internal table, on ABAP objects and object attributes…)
- The new conditional breakpoints and watchpoints
If you are interested in a live demonstration of the new features in ABAP breakpoints and watchpoints, just take a look at this short video:
1. New Breakpoint Types
If you are in the New ABAP Debugger and press the Breakpoint button, you will find a whole series of new tabs in the breakpoint popup. Each of these tabs introduces a special new breakpoint type, which you can choose accordingly to your special needs, when setting a breakpoint in your code. Let’s take a closer look at some of them.
ABAP Command Breakpoints
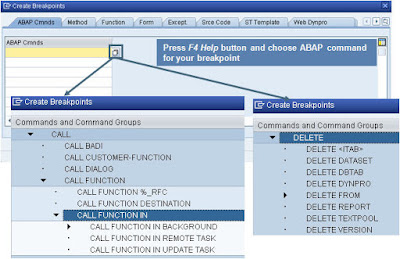
With the ABAP Cmnds tab, you can set a breakpoint on any of a variety of ABAP statements, shown to you in the F4 Help. The possibilities include setting a breakpoint at CALL FUNCTION, CALL FUNCTION DESTINATION, CALL FUNCTION IN REMOTE TASK, CALL FUNCTION IN UPDATE TASK, …. Many people didn’t know that there are also different DELETE variants: DELETE ITAB (delete from an internal table) is different from DELETE DBTAB (delete from a database table).
Method Breakpoints
With the Method tab, you can set a breakpoint at the invocation of a method of a class.
Simple Transformation and Web Dynpro Breakpoints
On the ST Template tab, you can set a row breakpoint at the call to a Simple Transformation template.
With the Web Dynpro tab you can set a breakpoint on Web Dynpro entities. When entering components, controllers and methods, the name of the generated class is determined and the breakpoint is set there. You can also tell the debugger to stop at each ABAP stack and screen change (Misc tab) or set a breakpoint on a message (Message tab).
2. Conditional Breakpoints
Imagine you need to debug an ABAP application in which an internal table is gradually filled with a large number of data records. Somewhere during the execution an error takes place and an incorrect data record gets inserted into the table. To analyze this behavior you can tell the debugger to stop as soon as this incorrect data record gets inserted into the table. You can do this by setting a breakpoint and adding a condition to it.
To add a condition to a breakpoint, click on your breakpoint with a right mouse button and choose Create Condition from the context menu. An additional popup is displayed, in which you can enter the test condition. You can use variables in the condition, as well as debugger symbols and functions. Use the F1 Help on the Breakpoint Condition popup to see the possible condition operands and syntax.
3. New Features in Watchpoints
Now it is possible to set a watchpoint for an internal table (this wasn’t possible in the classic debugger). Just press Watchpoint button and enter the internal table name in the Create Watchpoint popup. The debugger stops when the internal table is changed. You can further refine the watchpoint by specifying a condition (for example stop only if internal table contains more then 200 rows). Enter a condition in the Free Condition Entry field. Use the F1 help to learn which functions you can use in your conditions. The debugger will stop only if the internal table has changed and your specified condition is fulfilled.
In addition, the Break./Watchpoints tab shows which watchpoint has a hit, and you can for example view and compare a variables in its current (after stopping at a watchpoint) and previous state.
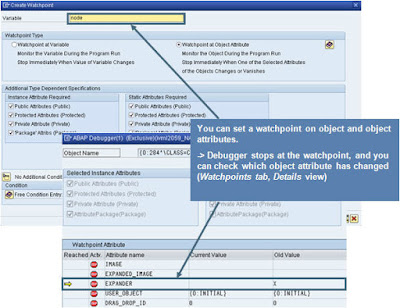
A further new feature is the ability to set watchpoints on objects. Just enter the object name in the Create Watchpoint popup. In this way you can monitor the object during execution of your program. The debugger will stop as soon as the object changes. You can also set a watchpoint at object attribute (choose Watchpoint at Object Attribute radio button) and select any desired types of instance and static attributes. The debugger then stops if an attribute has changed. Afterwards you can take a look at this attribute change on the Break./Watchpoints tab by selecting your watchpoint there and clicking on its details magnifier (in our example the ‘Expander’ attribute has changed from ‘X’ to a ‘space’).
4. Statement Debugging
Now imagine you are stepping through your code in the debugger and execute a long IF… statement, consisting of many different subcondtions. You expect a positive result, but unfortunately the IF… statement delivers you the negative answer. To analyze this behavior you need to understand which subcondition of this long IF…statement failed.
You can easily evaluate the conditions in the IF by changing the step size in the debugger. By pressing the Step Size button you activate the statement debugging, and the debugger will execute the subconditions of for example your long IF… statement separately one after another. You can then analyze return values of single subconditions on the Auto tab of the variable fast display window. By pressing the Step Size button again you return to a normal line stepping in the debugger.


No comments:
Post a Comment