What is Debugging???
◉ Identify Error.
◉ Identify the Error Location.
◉ Analyze Error.
◉ Prove the Analysis.
◉ Cover the Lateral Damage.
Debugging Efficiently means not only removing the errors and it will help us to understand the flow of program and also we can understand the business process or model of that particular requirement .
The purpose of this blog is to give overview of the various debugging techniques available in SAP. The primary focus of the document is for SAP ABAP consultants at moderate Level and ABAP learners.
Note: Comments from ABAP Experts are Appreciated.
Introduction to Debugging
The ABAP Debugger is used to execute and analyse programs line by line. Using it we can check the flow logic of a program and display runtime values of the variables.
Currently, SAP offers two types of Debuggers
◉ The Classic ABAP Debugger.
◉ The New ABAP Debugger.
◉ Recent Releases New Debugger is also called as ‘STANDARD DEBUGGER’
Switching between the ‘Classic Debugger’ and ‘New Debugger’
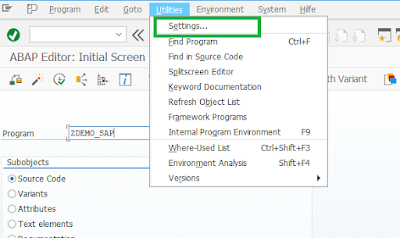
You can switch between both the debugger and make any one your default debugger. To do this, go to ABAP Editor (SE38) → Utilities → Settings
Now in the user-specific settings pop-up box click on ABAP Editor Tab and then click on Debugging.
Here you can select the New Debugger radio button to make it your default debugger.
External (User) Debugging
External debugging is used when we want to analyse our program which is called by an external user through HTTP such as WebDynpro ABAP, WebDynpro JAVA, and BSP etc. To activate external debugging, we have to set external breakpoints, which can be set just like the session breakpoints by keeping the cursor on the desired code line and clicking on the ‘External Breakpoint’ icon.
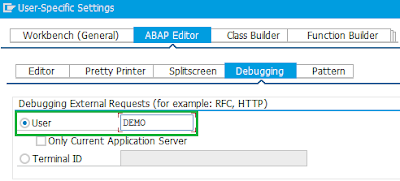
We can also set the external user for whom the breakpoint is to be activated by going to ABAP Editor (SE38) → Utilities → Settings, and in the ‘user-specific settings’ pop up box click on ABAP Editor Tab and then click on Debugging.
Here you can specify the username.
Watch point
Watch points can be used to break the execution of a program when the values in a variable change.
This helps us to go to the exact position where the variable changes. You can also specify conditions in Watchpoint, and the execution of the program will break as soon as the condition is fulfilled.
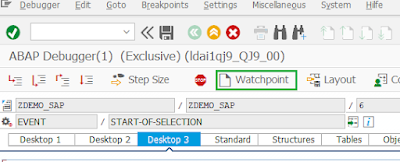
To create a Watchpoint, click to the Watchpoint button in the New ABAP Debugger.
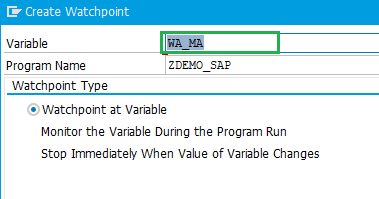
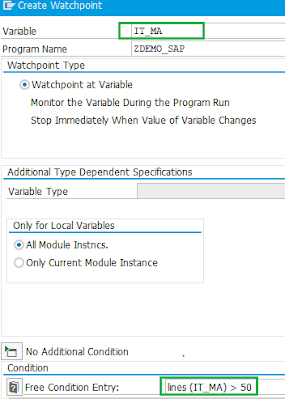
Now, in the Create Watchpoint pop up enter the variable name for which you want to create the Watchpoint.
For example, I will set a Watchpoint on the internal table itab1 to break when it is greater than 50 lines in content.
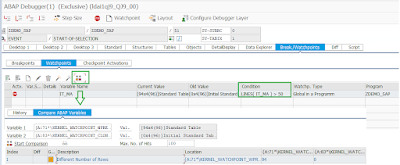
All currently set Watchpoint are listed in the watch points tab of the Breakpoints tool. Here you can create, edit, delete, activate, or inactivate Watchpoint. In addition to information such as the variable name, the scope, and the condition, you will find in the Watchpoint list a symbol for the “old variable” for all watch points. This information enables you to view the value of the variable of the recently hit Watchpoint before it was changed. I will execute the above Watchpoint for illustration of this point.
Some limitations of New ABAP debugger Screen Debugging
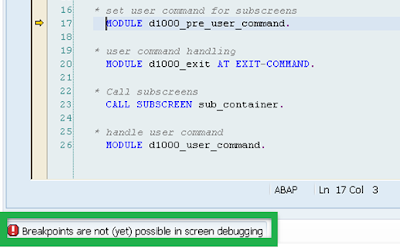
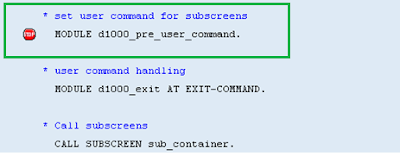
When you try to set breakpoints in screen/dialog programs, you get the message stating that debugging is not yet supported.
To get by this and debug your screen/dialog programs just switch back to the classical debugger.
ABAP Memory ID
In the new debugger it is not possible to view the used ABAP memory ID’s and their content. But, in the classical debugger you can view the ABAP memory IDs by going to Go to → System Areas → ABAP Memory.

In SAP Programming there are two kinds of breakpoints.
Static Breakpoints
These can be set by using statement BREAK-POINT in ABAP code, these breakpoints are not user specific, these will trigger for every user. We need to delete these breakpoints manually.
Ex: breakpoint. Ex2: break ADAGGUBATI.
Dynamic Breakpoints
These breakpoints are user specific; these will trigger for specific user only. These breakpoints will be deleted automatically when you log-off from SAP. These can be set in ABAP editor. Dynamic breakpoints can be set in active (activated) source code only.
Dynamic breakpoints are of two types. External breakpoint: These is a type of breakpoint, which will get activated even for Non SAP Applications, these breakpoints will be triggered from SAP or from Non-SAP example from portal screen.
Set it through Utilities – Setting – breakpoints.
Session breakpoint
This breakpoint will be activated for call only within SAP system and its active till the User session is on.
E.g., SE38
These breakpoints have different behaviours in different types of coding blocks ex: Function Modules, Sub-routines etc.
In this we will discuss the behaviour of breakpoints in each.
When we put breakpoint in some ABAP code, control will stop at the specific place when executing the ABAP program, then it is debugging mode. We can control debugging using function keys F5, F6, F7 and F8 or using toolbar buttons in debugging screen.
1. Working with static breakpoint.
Go to SE38, create a program ZSAPN_DEBUGGING, add below code and activate.
REPORT ZSAPN_DEBUGGING.
SKIP.
BREAK-POINT. “Static break-point
Save, activate and execute the program.
2. Working with Dynamic Breakpoint.
Go to SE38, create a program ZSAPN_DEBUG, and add below code.
REPORT ZSAPN_DEBUG.
DATA: IT_MARA TYPE TABLE OF MARA,
WA_MARA TYPE MARA.
PARAMETERS: P_MTART TYPE MARA-MTART.
SELECT * FROM MARA INTO TABLE IT_MARA UP TO 50 ROWS
WHERE MTART = P_MTART.
LOOP AT IT_MARA INTO WA_MARA.
WRITE: / WA_MARA-MATNR, WA_MARA-MTART, WA_MARA-MATKL, WA_MARA-MEINS, WA_MARA-SPART.
ENDLOOP.
Go to program source code, put cursor where you want to set breakpoint and click on set/delete external breakpoint icon.
Control Buttons:
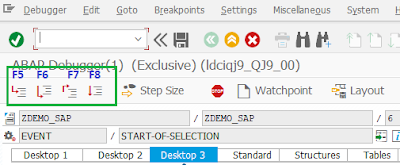
F5 – Step by Step.
F6 – Skips Function modules, routines, class methods & executes that block directly without entering it and with statements acts as F5.
F7 – Return from Subroutine or Function module and go to breakpoint.
F8 – Executes directly until next break point. No break point means directly executes the program.
SY-SUBRC = 0 At least one line was read.
SY_SUBRC = 4 No lines were read.
SY-SUBRC = 8 the search key was not fully qualified.
Shortcuts for debugging options
◉ Shift+f12 -> Go to statement.
The Magic of SHIFT + F12
You can use this key combination to bypass a specific line of code such as a normal sy-subrc check or an authorization check. To jump or bypass any line/lines of code all you have to do is just put your cursor on the desired line and then press the SHIFT + F12 key.
◉ Shift+f8 -> continue to cursor.(Place cursor at particular statement and it execute and will go to that statement).
Click in the breakpoint column whilst the key is depressed
◉ SHIFT => Set session breakpoint.
◉ CTRL => Set user Breakpoint.
◉ SHIFT+CTRL => Go to statement.
Tools of the NEW ABAP Debugger
The tools of the New ABAP Debugger are optimized for the different debugging situations you may have to deal with during solving a problem. Some of the tools you will recognize from the Classic ABAP Debugger; others are brand new. Before we look at a few of the tools and how to use them, lets first get comfortable with the tools menu and how the tools are organized.
If you want to add a new tool to the current desktop, you will get the pop-up window titled “New Tool” where you can choose the appropriate tool based on your situation.
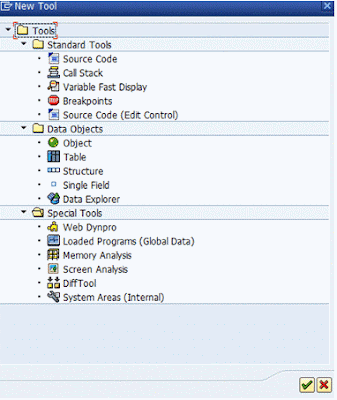
The New ABAP Debugger – Tools are grouped into sections
Standard Tools:
Source Code: Display current source code in the back-end editor. Please note that this is the old editor and I recommend you do not use this. There is another tool farther down the menu that will use the NEW Editor.
Call Stack: Display the current ABAP stack and screen stacks.
Variable Fast Display: Display variable value and type.
Breakpoints: Maintain breakpoints, watch points, and checkpoints.
Source Code (Edit Control): Display current source code in the NEW ABAP Front-End Editor. This is the option I recommend you use to enlist all the valuable enhancements of the new editor.
Data Objects:
1. Object: Display/change objects and classes.
2. Table: Display/change internal tables.
3. Structure: Display/change structures.
4. Single Field: Display/change variables with simple data types, such as C, N, D, T, STRING… etc.
Data Explorer: Display very complex data structures in a tree-like fashion.
It’s worth mentioning, that if you double-click on a variable displayed in any tool, you will launch the corresponding detail view described above that corresponds to its data type.
Special Tools:
1. Web Dynpro: The structure of the content of the current controller, the properties of the UI elements in the layout of the current view and the currently instantiated component usages.
2. Loaded Programs (Global Data): Display all currently loaded programs and their global variables.
3. Memory Analysis: Display integrated Memory Inspector tool (S_MEMORY_INSPECTOR)
4. Screen Analysis: Display the screen attributes and the sub screen stack.
5. Diff Tool: Compare variables very quickly to outline delta
6. System Areas (Internal): Display system areas such as SMEM, ABAP Memory, Datasets, Screen Attributes…etc.
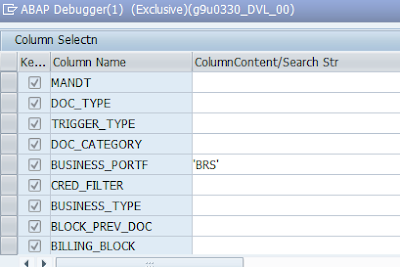
Finding field name in internal table in debugging using columns option
Click on Internal table in table contents we will see columns option and click on column configuration.

In Find icon we can give column name and directly we can observe.
To find any field when we are dealing with large Data in Internal Table when debugging
Select the category click on Find icon (Ctrl+F)
For Characters we should specify in single quotes
Integers-1234.




No comments:
Post a Comment