Both Java and ABAP can support automatic garbage collection. As an application developer the GC process are completely transparent for us and in our application code most of the time we should never call the GC API provided by Java or ABAP. Nevertheless it helps us to write more robust code with comparatively lower memory consumption if we have some basic understanding about the trigger point of Garbage collection.
Use this small code below for test, which allocates 2MB memory every 100 millisecond.
package memoryTest;
import java.util.Timer;
import java.util.TimerTask;
class MyTask extends TimerTask{
static final int MB = 1024 * 1024;
@Override
public void run() {
byte[] a1 = new byte[2 * MB];
a1[1] = 1;
Runtime runtime = Runtime.getRuntime();
System.out.print("total :" + (runtime.totalMemory() / 1024)+ " KB\n");
long free = runtime.freeMemory() / 1024;
System.out.print("free:" + free+ " KB\n");
}
}
public class MemoryAllocationTest {
static public void main(String[] arg){
Timer timer = new Timer();
timer.schedule(new MyTask(), 100, 100);
}
}
Execute the program with the following VM argument.
The option PrintGCDetails can print out GC execution detail and Xmx40m means the max allowed heap allocation size is 40MB.
Garbage Collection in Java
Use this small code below for test, which allocates 2MB memory every 100 millisecond.
package memoryTest;
import java.util.Timer;
import java.util.TimerTask;
class MyTask extends TimerTask{
static final int MB = 1024 * 1024;
@Override
public void run() {
byte[] a1 = new byte[2 * MB];
a1[1] = 1;
Runtime runtime = Runtime.getRuntime();
System.out.print("total :" + (runtime.totalMemory() / 1024)+ " KB\n");
long free = runtime.freeMemory() / 1024;
System.out.print("free:" + free+ " KB\n");
}
}
public class MemoryAllocationTest {
static public void main(String[] arg){
Timer timer = new Timer();
timer.schedule(new MyTask(), 100, 100);
}
}
Minor Garbage Collection in Java
Execute the program with the following VM argument.
The option PrintGCDetails can print out GC execution detail and Xmx40m means the max allowed heap allocation size is 40MB.
When executing you can find following output in console:
total :39424 KB
free:35720 KB
total :39424 KB
free:33672 KB
total :39424 KB
free:31624 KB
total :39424 KB
free:29576 KB
[GC (Allocation Failure) [PSYoungGen: 9847K->744K(11776K)] 9847K->752K(39424K), 0.0022270 secs] [Times: user=0.00 sys=0.00, real=0.00 secs]
total :39424 KB
free:36457 KB
total :39424 KB
free:34409 KB
total :39424 KB
free:32361 KB
total :39424 KB
free:30313 KB
[GC (Allocation Failure) [PSYoungGen: 9102K->616K(11776K)] 9110K->632K(39424K), 0.0018849 secs] [Times: user=0.00 sys=0.00, real=0.00 secs]
total :39424 KB
free:36564 KB
The GC log clearly shows that every time JVM fails to find a proper memory area in young generation, a GC operation is launched AUTOMATICALLY.
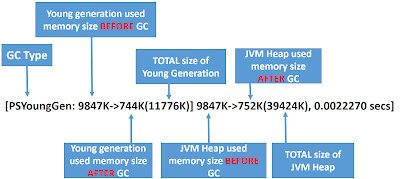
Let’s analyze the log: [GC (Allocation Failure) [PSYoungGen: 9847K->744K(11776K)] 9847K->752K(39424K), 0.0022270 secs]
Some knowledge to understand this log
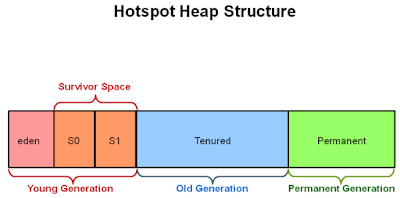
From Java official website we know the Heap in Hotspot( one kind of JVM ) consists of Young Generation, Old Generation and Permanent Generation.
The Young Generation is where all new objects are allocated and aged. When the young generation fills up, this causes a minor garbage collection. This GC could be observed in our log that once GC is done, the free space size in young generation increases greatly.
All minor garbage collections are “Stop the World” events. This means that all application threads are stopped until the operation completes. The time spent on GC is also printed in the log, in our example:
Full Garbage Collection in Java
Now let’s do some change on the source code. This time I allocate 1GB instead.
VM argument is changed to -Xmx6000m accordingly.
Log:
total :1525248 KB
free:488140 KB
total :2549760 KB
free:488652 KB
total :3574272 KB
free:489164 KB
[GC (Allocation Failure) [PSYoungGen: 13107K->632K(152576K)] 3085107K->3072640K(4248576K), 0.0246054 secs] [Times: user=0.13 sys=0.00, real=0.02 secs]
[GC (Allocation Failure) [PSYoungGen: 632K->664K(283648K)] 3072640K->3072672K(4379648K), 0.0243200 secs] [Times: user=0.25 sys=0.00, real=0.03 secs]
[Full GC (Allocation Failure) [PSYoungGen: 664K->0K(283648K)] [ParOldGen: 3072008K->539K(268800K)] 3072672K->539K(552448K), [Metaspace: 2662K->2662K(1056768K)], 0.2419282 secs] [Times: user=0.11 sys=0.22, real=0.24 secs]
total :1576960 KB
free:547177 KB
total :2601472 KB
free:547689 KB
total :3625984 KB
free:548201 KB
[GC (Allocation Failure) [PSYoungGen: 5242K->0K(283648K)] 3077782K->3072539K(4379648K), 0.0127622 secs] [Times: user=0.03 sys=0.00, real=0.01 secs]
[GC (Allocation Failure) [PSYoungGen: 0K->0K(521728K)] 3072539K->3072539K(4617728K), 0.0115785 secs] [Times: user=0.13 sys=0.00, real=0.01 secs]
[Full GC (Allocation Failure) [PSYoungGen: 0K->0K(521728K)] [ParOldGen: 3072539K->1024K(275456K)] 3072539K->1024K(797184K), [Metaspace: 2662K->2662K(1056768K)], 0.2102163 secs] [Times: user=0.03 sys=0.17, real=0.21 secs]
total :1821696 KB
…
The last test in Java
Now I change option Xmx6000m to Xmx900m, and OutOfMemoryError exception is raised as expected. From the log we know that GC still tried it best to find available memory for allocation but failed.
Garbage Collection in ABAP
Execute the following program twice, the first time with manual clear = abap_false and the second time abap_true.
PARAMETERS: clear TYPE c as CHECKBOX DEFAULT abap_false.
TYPES: tt_table TYPE TABLE OF tadir WITH KEY pgmid object.
DATA: lt_result TYPE TABLE OF tadir,
lt_total TYPE TABLE OF tadir,
lr_result TYPE REF TO tt_table.
DATA: c1 TYPE cursor.
OPEN CURSOR @c1 FOR SELECT * FROM tadir.
DO.
WRITE: / |Round: { sy-index } | COLOR COL_NEGATIVE.
CREATE DATA lr_result.
FETCH NEXT CURSOR @c1 INTO TABLE @lr_result->* PACKAGE SIZE 800000.
IF sy-subrc <> 0.
EXIT.
ENDIF.
APPEND LINES OF lr_result->* TO lt_total.
cl_abap_memory_utilities=>get_memory_size_of_object( EXPORTING object = lt_total
IMPORTING
bound_size_alloc = DATA(bound_alloc)
bound_size_used = DATA(bound_used) ).
WRITE: / 'bound alloc:' , bound_alloc.
WRITE: / 'bound used:' , bound_used.
cl_abap_memory_utilities=>get_total_used_size( IMPORTING size = DATA(lv_before_size) ).
WRITE: / |Total size before GC: { lv_before_size }| COLOR COL_POSITIVE.
IF clear = abap_true.
CLEAR: lr_result->*, lt_result, lr_result.
ENDIF.
cl_abap_memory_utilities=>do_garbage_collection( ).
cl_abap_memory_utilities=>get_total_used_size( IMPORTING size = DATA(lv_after_size) ).
WRITE: / |Total size after GC: { lv_after_size }| COLOR COL_GROUP.
DATA(rate) = ( lv_before_size - lv_after_size ) * 100 / lv_before_size.
WRITE: / |Freed rate: { rate }%| COLOR COL_TOTAL.
ENDDO.
WRITE: / lines( lt_total ).
Compare the output of two execution we find out the final filled result, lt_total, are equal for both execution. And the temporary variable lr_result->*, lt_result and lr_result used to store the data queried from database table during each iteration are useless once the content are appended to the final result internal table, so in principle they are ok to be cleared manually. The comparison shows that if within a LOOP you have local variable which holds a large amount of data which is only handled in current loop, then you can manually clear it before the next round of loop starts to free up memory.
You may argue that does the line below really take effect during the comparison?
cl_abap_memory_utilities=>do_garbage_collection( ).
Good question! If it is commented out and execute report with manual clear = abap_true, still the same output will be printed out as before it is commented out.
So let’s look at another example:
REPORT z.
PARAMETERS: call_gc type char1 as CHECKBOX DEFAULT abap_false.
class lcl_memory_test DEFINITION.
public SECTION.
methods: constructor.
PRIVATE SECTION.
data: mt_data type TABLE OF tadir.
endclass.
class lcl_memory_test IMPLEMENTATION.
method: constructor.
SELECT * INTO TABLE mt_data FROM tadir.
endmethod.
endclass.
START-OF-SELECTION.
data(lo_class) = new lcl_memory_test( ).
cl_abap_memory_utilities=>get_total_used_size( IMPORTING size = DATA(lv_before_size) ).
WRITE: / |Total size before GC: { lv_before_size }| COLOR COL_POSITIVE.
CLEAR: lo_class.
IF call_gc = abap_true.
cl_abap_memory_utilities=>do_garbage_collection( ).
ENDIF.
cl_abap_memory_utilities=>get_total_used_size( IMPORTING size = DATA(lv_after_size) ).
WRITE: / |Total size after GC: { lv_after_size }| COLOR COL_GROUP.
DATA(rate) = ( lv_before_size - lv_after_size ) * 100 / lv_before_size.
WRITE: / |Freed rate: { rate }%| COLOR COL_TOTAL.
This time I wrap the code to manually trigger GC with a switch call_gc:
Execute it first with call_gc = abap_false, and the result shows even though you have manually clear the reference of lo_class, still no memory is free up.
And the second time call_gc = true.
The GC processor has done a good job!
Last but not least, the purpose of this ABAP example is not asking you to call GC API manually in your application code, conversely, you should always avoid to do that.


No comments:
Post a Comment