While the SAP BTP platform has witnessed significant progress and adoption, offering numerous development tools for SAP platforms, it's noteworthy that SAP GUI for ABAP continues to be widely utilized in many organizations and projects. This document aims to deliver succinct information about the SAP GUI ABAP debugger, specifically catering to SAP functional consultants and ABAP newcomers.
Note that certain features are also accessible during debugging in Eclipse ADT. Personally, I favor using the Eclipse IDE.
Breakpoint: A breakpoint is a specific point in your program where the execution of instructions comes to a halt. In ABAP, there are four ways to interrupt the execution of your program:
1. Session breakpoint: These breakpoints are specific to the current session of SAP GUI and the user who sets them. Session breakpoints do not function for remote debugging.
2. External breakpoint: External breakpoints have a duration and apply to the user who sets them, regardless of the session. They are suitable for remote debugging.
3. Debugger breakpoint: Debugger breakpoints are applicable when a debugger session is active and disappear once the debugger window is closed.
4. Breakpoint statements: These are specific statements in the ABAP program that pause the program's execution. They can be used in two ways:
a. BREAK-POINT: Always active for all users.
b. BREAK <USER_ID>: Triggers only for the specified user.
Note: You cannot set more than 30 breakpoints and 10 watchpoints in a program.
To debug a transaction, we can enter /h, /ha, /hs in the command field
◉ /h: Turns on the debugger where you can even debug the dialogue programs.
◉ /hs: Turns on the system debugger and allows you to debug the system programs, also turns on update debugging.
◉ /ha: Turns on the debugging without screen handling. Skips PBO, PAI.
Key commands - The following commands can be used while debugging an ABAP program:
- Single step (F5): The single-step command executes one instruction at a time while you go ahead. Suppose you give a single-step command at a subroutine or function call. In that case, the debugger will navigate to the program for that subroutine, a function module, or any other object that is used for the modularization.
- Execute (F6): When you take the execute action, the debugger steps over a given line. If the line contains a function or a subroutine the function will be executed, and the result will be returned without debugging each line inside that subroutine or function.
- Return (F7): While debugging if you get inside a subroutine or function module with single steps, the return command navigates the debugger to the line where the current function or subroutine was called.
- Continue (F8): Executes the whole program and switches to the output screen. (Or halts at the next breakpoint if encountered)
# Ready, set, execute!
Once you put the breakpoint and execute the program, your program will be interrupted during the execution and the ABAP debugger will start in a new window. Below is a picture of the ABAP debugger screen.
The ABAP debugger window depicted above can be divided into six components for better comprehension:
1. Menu bar
2. SAP’s standard toolbar
3. The debugger toolbar
4. Source code attributes
5. Tabs and Services of tool
6. Context menus
Each of the seven components within the ABAP debugger contains multiple options. Let's examine each of them individually.
Menu bar
1. Debugger menu: The initial menu visible on the menu bar is the Debugger menu. Clicking on it will reveal eleven options. The first four options will be elaborated upon in the subsequent section about the debugger toolbar. Let's now focus on the remaining seven options.
I. Continue to Cursor (Shift + F8): Continue to cursor option will execute your program till the place where your cursor is blinking in the source code tool of the debugger. If your cursor is above the current line where execution is halted, the "Continue to Cursor" option will just execute the whole program.
II. Goto statement (Shift + F12): The Goto statement will halt the program execution at the point where your cursor is placed in your source code tool. Unlike Continue to Cursor, the "Goto statement" skips the execution of the statements between your current line and the line where your cursor is present.
III. Debugger Session: The Debugger session opens a submenu of five more options.
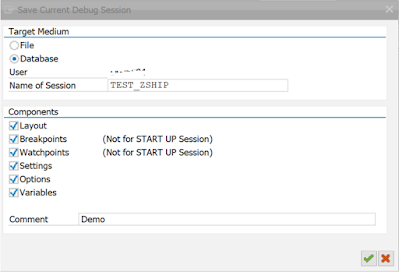
a. Save: With Save, you can save your debugger layout, including breakpoints, watchpoints, layer-aware configuration, the layout of your debugger subscreens, and the variables you’ve entered into the variable fast display. In the below screenshot, you’ll see the text (Not for START-UP Session). The START-UP session is the default debugger session that is used when launching the ABAP debugger if no user layout is found. When creating a new START-UP session, you cannot specify breakpoints or watchpoints.
b. Load (Shift + F11): After saving your debugger session, other ABAPers can load the same session by following the menu path Debugger -> Debugger Session -> Load. The debugger load dialog is similar to the debugger save. You can specify whether you want to load the debugger session’s layout, breakpoints, etc.
c. Overview/Delete: If you click on the Delete option, a new window opens. This window is a transaction in SAP where you can display and delete the saved variants.
d. Overview/Delete: If you click on the Delete option, a new window opens. This window is a transaction in SAP where you can display and delete the saved variants.
e. Save layout (Ctrl + Shift + F3): You can rearrange the layout of any of the tabs in the debugger. With the Save layout option, you can save the rearranged tabs. However, SAP will prevent you from saving changes to all but the Desktop tabs. When you save a debugger layout, SAP will remember your custom layouts on all three desktop tabs and they will be available to you every time you launch the ABAP Debugger. We’ll explore more about rearranging the tabs in the later section.
f. Designation of the User Desktop: With this option, you can rename the Desktop tabs.
IV. Restart: The restart option restarts the whole program from the beginning.
V. Exit (Close Application): Closes the whole application and terminates the further execution of the program.
VI. Exit (Application continues running): Closes the Debugger while continuing to run the application.
2. Edit menu: The Edit menu has five options. Search and Find Next in the edit menu only works in the variables fast display tool. System functions -> Start Garbage Collector option removes the unreferred objects from the memory. Cancel terminates the application without further execution.
3. Goto menu: If you click on the Goto menu, the first option will be “Goto source code”. Goto source code opens a new ABAP editor window for source code which is being debugged currently. Navigate to option can be used to navigate to different tabs you see on the debugger screen.
4. Breakpoints: Let’s look at all the options in the Breakpoints menu.
I. Delete all BPs (Shift + F2): Deletes all the breakpoints including, session breakpoints, and debugger breakpoints. The breakpoint statements and watchpoints, however, will still work.
II. Deactivate all BPs (Ctrl + Shift + F6): This option deactivates all the breakpoints until the current debugger session is opened.
III. Activate all BPs (Ctrl + Shift + F7): Activates all the breakpoints if there are any deactivated ones.
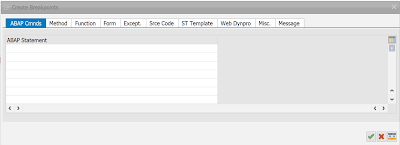
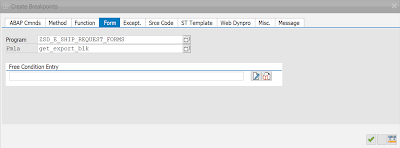
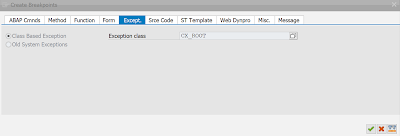
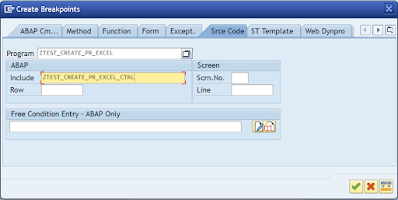
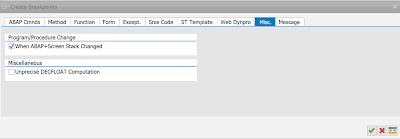
IV. Create breakpoint (F9): If you click on “Create breakpoint”, it opens a new dialog box for an option for creating the breakpoints anywhere in the current program. In this dialog box, you can create dynamic breakpoints at different elements of the ABAP program.
a. ABAP Cmnds: In the ABAP Cmnds tab you can enter a statement of abap program and the dynamic breakpoints will be set at every one of those statements. For example, we can write ‘CALL FUNCTION’ to set the dynamic breakpoints at all the function call statements in the current ABAP program.
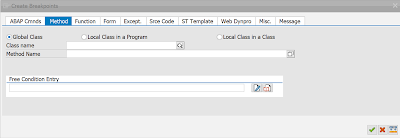
b. Method: You can put a dynamic breakpoint on any method that is called in the current session. You can also add a breakpoint at a method call that is specific to the program name or a class.
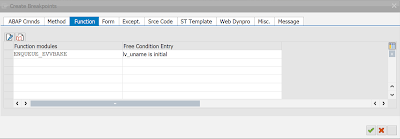
c. Function: A dynamic breakpoint can also be added for a call of a function in the whole session. Notice that there is a column with the header “Free Condition Entry”. In this column, you can add a condition for a conditional breakpoint. Conditional breakpoints are explained later in this document.
d. Form: In the Form tab, you can add a dynamic breakpoint on a call of a subroutine inside the program you want.
e. Except.: Except. tab can be used to set the dynamic breakpoints on exceptions. Every ABAP exception has a class associated with it. If you don’t know the specific class, then you can put a breakpoint on exception ‘CX_ROOT’, which is the base for all the ABAP exceptions.
f. Srce Code: The dynamic breakpoints can also be put while debugging at the program source code by specifying the program/include the program name and the row(line).
g. Misc: In this tab, you can ensure that the program stops at the call stack change in the program. By marking the “Unprecise DECFLOAT Computation” checkbox, the execution marker will stop at the point where an imprecise calculation of a floating point number takes place.
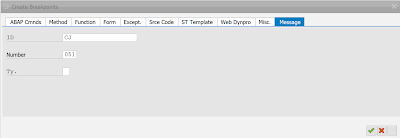
h. Message: If you want to find where in the program a message is being called, a breakpoint at the message can help you find that. All you need is the message ID and message number.
V. Line breakpoint: Select Line breakpoint -> Set/Delete option to put a breakpoint where your cursor currently is. Select Line breakpoint -> Activate/Deactivate to toggle activation or deactivation of the breakpoint of a selected line.
VI. Breakpoint at: The "breakpoint at" opens a context menu of different options to create a dynamic breakpoint. All these options are described in the Create Breakpoint section.
VII. Reload BPs: Reload BPs reload the session and external breakpoints if they’re deactivated.
VIII. Save Debugger BPS as: You can save the debugger breakpoints for the current SAP GUI session or current user sessions.
IX. Create Watchpoint: A watchpoint is a special breakpoint that stops the execution of an application whenever the value of a given expression changes, without specifying where it might occur. You can put a watchpoint on a variable or object instance by entering the variable name in the Create watchpoint dialog.
X. Settings: The first option in the settings menu is “System Debugging On/Off”. This enables system debugging of the application. If your system debugging is You can click on, your screen title will show something like below where (/hs) denotes system debugging.
SAP’s standard toolbar:
◉ Although the standard toolbar of SAP behaves the same for all the applications in SAP, the Save option of ABAP debugger will save the debugger breakpoints as session breakpoints.
The debugger toolbar:
1. The first four icons of the debugger toolbars are the four key comments that are defined at the beginning of this blog.
2. The “Step Size” icon changes the way a statement is executed. By default, the debugger executes one line at a time, but if you change the step size of the execution, the debugger will execute each operation performed in statements with a chain operator.
3. The other two icons are for “Create breakpoint” and “Create watchpoint”.
4. Save layout: This is the icon for the Save Layout option in the debugger menu.
Source code attributes:
1. The part of the debugger screen in the above image shows the attributes of the current program that is being debugged. The first bar has the name of your master program for the current source code and the bar next to it has your current program name. Clicking on the icon opens the source code of the program that you are debugging in a separate window of the ABAP editor.
2. SY-SUBRC is the return code set by the previously executed ABAP statements. If SY-SUBRC is 0, the previous statement has been executed correctly.
3. SY-TABIX is a system variable that stores the index of the latest accessed record in an internal table.
Services of tool and Tabs:
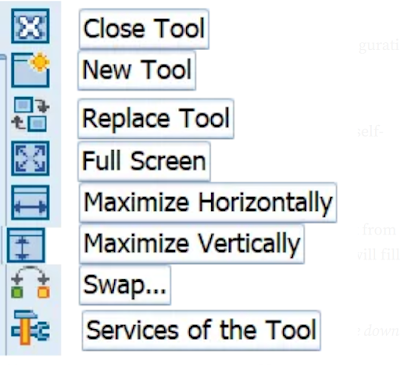
The tabs are your work areas in the debugger. You’ll see the debugger tools here. Before we start looking at the tabs, let's get to know the Debugger Tool settings ribbon. This ribbon helps you change how your current tab looks and add or remove different tools like source code, Call Stack, Breakpoints, and so on.
◉ Services of the Tool (In the Debugger Tool ribbon) : The Services of the Tool icon launches a popup with additional functionality available in each tool. The functions available differ based on the tool you’re using, but some examples are:
1. Better filtering of variable lists in the Variable Fast View Tool.
2. Save Data as an "SE37" variant in the Variable Fast View Tool.
3. Debug ABAP macros.
◉ Some of the debugger tools are explained below:
1. Source Code: Displays an older view of the source code display.
2. Call Stack: Shows the call stack of the functions, subroutines, or events. You can backtrack your function call using call stack. You can change the configuration to show only screens in the call stack or only ABAP events in the call stack. By default, both screens and ABAP events are shown.
3. Variable fast display: You have two Variables tabs for the definition of variables, tables, and objects you’re interested in exploring further. You can save these lists by clicking on the disk icon seen in the screenshot.
I. The Locals tab shows all variables defined in the current event’s scope. The Globals tab shows all variables that are visible and available in the current event across the ABAP call stack.
II. If you scroll to the right side you’ll find the absolute type of a variable. You can double-click on the type to open it in a new window.
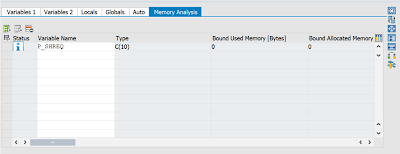
III. The Memory Analysis tab can show the memory details of the variable. If shows the bytes of memory allocated to any variable. This might help you to make your code more memory-efficient.
IV. If you change the debugger step size to Statement, the Auto tab will display the return variables of individual statements or method calls chained together.
4. Breakpoints: You can see the list of breakpoints or watchpoints and perform operations on them which are available in the Breakpoints menu.
5. Object: The object tool allows you to explore the contents of data variables declared using TYPE REF TO. This typically involves browsing the contents of a class instance when you're dealing with OOP.
6. Table: Table tool allows you to edit and explore the contents of the internal table at runtime.
7. Structure: Structure tool displays and allows you to edit the structure in ABAP memory. You can also download structure contents as XML.
8. Single field: The single field displays the contents of an absolute type. You can edit the field contents as well.
9. Data Explorer: Allows you to explore and interact with many different kinds of data types, from class instances to tables. This is a very versatile tool if you’re working with different kinds of objects in the debugger.
10. Memory Explorer: This tool provides you the insights into how much memory your program is using.
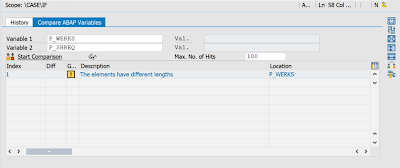
11. Difference tool: This tool can compare similar types of variables for you. This tool also keeps the history of the variables that you’ve compared before.
◉ Desktop tabs: The Desktop 1, Desktop 2, and Desktop 3 tabs are yours to play with. All the customizations you do on these desktops can be saved.
◉ Standard tab: In the Standard tab where you will work with the Call Stack, Variable fast display, and Source code. You can customize it for the current session.
◉ All the other tabs are dedicated tabs for different Services or tools.
Context Menus:
◉ If you right-click on the source code tool in the ABAP debugger, you will find an option called "ABAP bytecode (debug macro)." Choosing this option transforms your source code from ABAP to ByteCode. When an ABAP program is written and activated, it gets converted into ByteCode, somewhat resembling assembly code. The ABAP runtime interprets this ByteCode. Therefore, while debugging a macro, you can see only the ByteCode rather than the original ABAP source code.
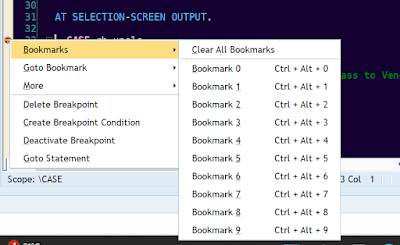
◉ To add bookmarks while debugging, right-click on the yellow strip located to the left of the line numbers in the source code. A context menu, similar to the one illustrated below, will appear. This menu allows you to place bookmarks on the clicked line, enabling you to return to that specific point later during the debugging process.
I've attempted to provide an overview of the key features of the SAP GUI ABAP debugger to the best of my knowledge. As you delve into extensive programs, you may discover and learn to utilize many more features.



No comments:
Post a Comment