It’s easy to write your own ABAP Debugger Scripts in NetWeaver 7.0 EHP2, either for ad hoc use directly in the debugger or for re-use by you or your colleagues. An ABAP Debugger Script is an ABAP Objects program that runs under the control of the debugger. The script automates your activities in the debugger by calling the services offered by the ABAP Debugger. In this weblog, we show you how to write a script, whereby the most important topic is how to use the Script Wizard to call the services of the ABAP Debugger from a debugger script. We also demonstrate some sample scripts for tracing, creating individualized breakpoints, and extracting data for display from complex data objects.
For a quick introduction to the Script workplace and ABAP Debugger Scripting, see also the weblog ABAP Debugger Scripting: Basics.
Here is a video on advanced debugger scripts.
For a quick introduction to the Script workplace and ABAP Debugger Scripting, see also the weblog ABAP Debugger Scripting: Basics.
Here is a video on advanced debugger scripts.
1. Where to Work on Scripts
The Debugger or Transaction SAS You can write scripts on-the-fly, while you are in the debugger. But writing scripts directly in the debugger ties up a Dialog work process for as long as you are in the debugger. If you are preparing anything other than a simple script, then transaction SAS, +ABAP Debugger Scripting and Tracing+, offers a more comfortable and efficient place to work. Transaction SAS also lets you view traces that you have created as well as those created by other users (you can easily share a trace with a colleague). More importantly for our present purposes, it also provides the same script editing facilities as the +Script+ tab in the debugger (only the +Start Script+ button is missing).
2. Calling Debugger Services from a Debugger Script
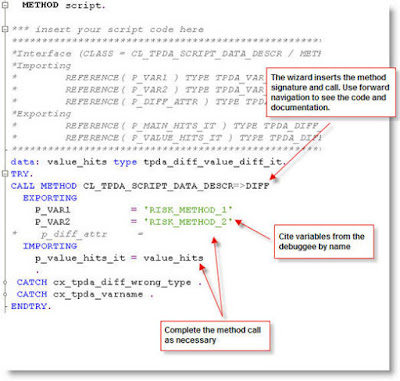
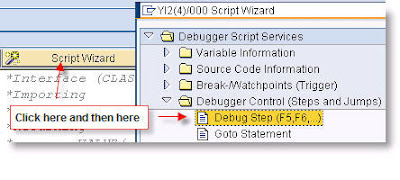
In this section, we’ll show you how to access debugger services from your scripts. When you write a script, you modify a script template that the Script tool automatically loads into the script editor. Of course, you can use almost any ABAP OO statements or constructs that you can think of in a script. But the real meat of the script is in the calls to debugger services (via the ADI – ABAP Debugger Interface) that you can insert into your script. You insert debugger service calls into your scripts with the *Script Wizard*. To add code from the wizard, position the cursor in the script editor at the point at which the wizard code should be inserted. Then do the following: * Choose the code snippet that you need from the published ADI functions. As you can see, a wide range of method calls are ready
for you to use.
Complete the method call that the wizard inserts into your script. Then you can add more code of your own to evaluate the comparison of variables, and perhaps another ADI call to trace the results.
3. A Script for Tracing the Call Hierarchy
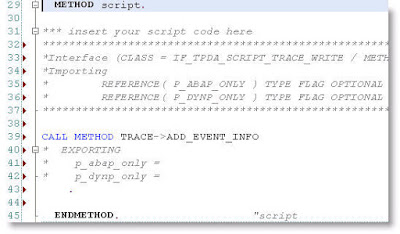
Having a call hierarchy is useful if you want to use layer-aware debugging, but you aren’t sure what to include in the software layer that is to be visible in the debugger. This simple script generates a trace of the call hierarchy. It is so easy to implement that you can set it up directly in the debugger – no need to use transaction SAS. Here’s how to trace the call hierarchy: 1. Stop the program that you want to trace in the debugger. It does not matter how you stop the program in the debugger. It does not matter where you are in the program. (It can be useful to trace the call hierarchy just for the part of the program in which you are interested – between two breakpoints that you set in the source code editor, for example). 2. 3. Click on the +Script+ tab, the very last tab (for now) in the tool set of the New ABAP Debugger. 0.1. 0.2. In the script editor, scroll down to the SCRIPT method, which is where the main part of your script should be implemented. You’ll see the comment +*** insert your script code here +together with a default debugger call, +me->break( )+ – which calls a breakpoint when the SCRIPT method runs. Comment out the +me->break( )+ method – you probably don’t want to stop in the debugger with every new call in the call hierarchy, right? Before continuing, let’s take a moment to review the four pre-defined methods in class LCL_DEBUGGER_SCRIPT. Chances are that you will need only the SCRIPT method, but even so… 0.1. +PROLOGUE+: In this method, the Debugger Script infrastructure generates the +ABAP_SOURCE+ handler for accessing the code and variables in the program that is being debugged. Your own initialization code, if any, should go in the +INIT+ method. This method runs only once, the first time that a script runs. +ABAP_SOURCE+ is an instance of the class +CL_TPDA_SCRIPT_ABAPDESCR+. +ABAP_SOURCE+ is used by predefined methods and scripts to get information about the source code that is running in the debugger. You can also use the methods exposed by +ABAP_SOURCE+ yourself, should you need to do so. 0.1. +INIT+: In this method, you can do any initial setup that you need to do, for example, collecting such interactive input as the name of an object to test or the value to assign to a variable. (Yes, any UI elements permitted in ABAP Objects can be used in a Debugger script.) Like the +PROLOGUE+ method, the +INIT+ method runs only once, the first time that a script is started. 0.1. +SCRIPT+: You pack your operational script code in this method. Should you wish to, you can add your own methods to +LCL_DEBUGGER_SCRIPT+ that are called from the +SCRIPT+ method. The Debugger Infrastructure runs the +SCRIPT+ method every time that the script should be started. For example, if you specify that the script should start with every +Debugger Single Step+, then the very first time that the script runs, +PROLOGUE+ and +INIT+ will be executed. The +SCRIPT+ method will also be run. With every subsequent +Single Debugger Step+, the infrastructure runs the +SCRIPT+ method only. When you end the execution of the script, then the +END+ method is run. 0.1. +END+: In this method, you can do any clean-up or post-processing that is needed. For example, The debugger runs +END+ only once, when you press the +Exit Script+ button. The +END+ method is not run in the event that a script is aborted because of an error or in the event that the debugger itself is terminated through user action.0.1. 0.2. Get the method call for tracing the method hierarchy. Click on the +Script Wizard+ button. Then open the +Write Trace+ folder. And finally double-click on +Trace of the Call Hierarchy (Current Event)+ entry to insert the call to method ADD_EVENT_INFO() of IF_TPDA_SCRIPT_TRACE_WRITE.
0.1. 0.2. Set the trigger condition to +Breakpoint Reached+. Then click on the +Change+ icon to open the +Script Breakpoints+ tool.
Remember thatscripts start only for breakpoints set from the +Script+ workplace. Breakpoints that you set for example in the source code editor do not cause a script to be run. This arrangement lets you separate breakpoints and watchpoints for triggering a script from those that you set for your own use. 0.1. Create a stack-change breakpoint. Among other new types of breakpoint introduced with NetWeaver 7.02 EHP2 there’s one just for this purpose.
0.1. 0.2. Tell the ABAP Debugger to start running the script by pressing +Start Script+. Note: The debugger runs the debuggee-program as if you had pressed the +Continue (F8)+ button in the tool bar of the New ABAP Debugger. At each change in the stack, the +Trigger+ condition that you set causes the ABAP Debugger to run your script. The Debugger itself does not stop execution at the script breakpoints. In order to stop the debugger and return control to you, the script itself must request a breakpoint. Or you must encounter a breakpoint that you set for yourself, not as a trigger in the script workplace. 0.1. Tell the New ABAP Debugger to stop running the script so that you can take a look at the trace. If you have arrived at the next non-script breakpoint in your code, then the debugger has control. You can tell the debugger to keep running the script or to stop running the script directly.
control has returned to the program that you are debugging, at screen output, for example, then you need to return control to the debugger so that you can stop the script.
The debugger returns to the foreground, and you can click on +Exit Script+ or +Continue Script+. 0.1. Display the trace in the debugger session or in an internal session by clicking on +Display+ or +Start Analysis in New Session+.
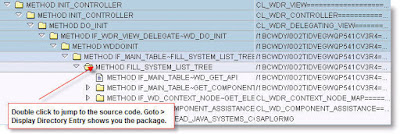
Here is what the call hierarchy trace might look like. You can use such a trace, for example, to find out what packages or other objects belong in a software layer for layer-aware debugging. You can also add logic to test for errors and issue special trace messages or break execution as your script traverses the call hierarchy.
A Script for Checking the Results of RFC Calls We recently had the following problem: In a large customer landscape, one or more programs that were called remotely with RFC were returning garbage. You can’t easily use a conditional breakpoint or a watchpoint to detect the RFC destinations that are returning corrupted data. With a script, you can find the bad destinations quickly. Here is how you could build such a script: 1. You would want to work in transaction SAS, in the +Script Editor+ tab, since the script will be relatively long and can be modified and re-used for analyzing other RFC problems.0.1. After +Creating+ and naming the script, you can first set the +Trigger+ condition. Set the +Trigger+ condition to +Breakpoint+ +Reached+ and then create a script breakpoint. Click on the +Change+ icon that appears next to +Breakpoint Reached +(below). The trigger condition is saved with the script and is set automatically when you load the script in the debugger.
Create an RFC breakpoint. Setting a breakpoint on the ABAP Command ‘RFC’ tells the Debugger to run the script every time an RFC call is made
- Then switch to the editor and position the cursor in the SCRIPT method, where you see
+*** insert your script code here+ me->break( ). You’ll probably want to comment out the BREAK instruction. If you wish to, you can have the script run it when it encounters bad data returned by an RFC. You can stop the program that you are debugging and use the debugger to look at the problem more closely. You could call that an ‘intelligent Debugger Script breakpoint’. Since the script runs whenever an RFC call is to be made, we’ll need this logic: 0.1. Run a debugger step to execute the RFC call 0.2. Read the variable or variables that we want to check 0.3. Apply tests to the value of the variable(s) – our own ‘application logic’, so to speak. 0.4. If we find bad data, write a user-defined trace message, stop with a debugger breakpoint, or do both actions. Insert the first instruction – running the RFC function call – by using the Script Wizard to insert this debugger method call:
As you can see, the method signature lists the constants for the different types of debugger steps and jumps. We also uncomment the TRY and CATCH statements inserted by the Wizard. +* me-> break( ).+
+*************************************************+
+* debugger commands (p_command):+ +* Step into(F5) -> CL_TPDA_SCRIPT_DEBUGGER_CTRL=>DEBUG_STEP_INTO+ +* Execute(F6) -> CL_TPDA_SCRIPT_DEBUGGER_CTRL=>DEBUG_STEP_OVER+ +* Return(F7) -> CL_TPDA_SCRIPT_DEBUGGER_CTRL=>DEBUG_STEP_OUT+ +* Continue(F8) -> CL_TPDA_SCRIPT_DEBUGGER_CTRL=>DEBUG_CONTINUE+
+*************************************************+
+****************************************************************+
+*Interface (CLASS = CL_TPDA_SCRIPT_DEBUGGER_CTRL / METHOD = DEBUG_STEP )+
+*Importing+
+* REFERENCE( P_COMMAND ) TYPE I+
+****************************************************************+ TRY. CALL METHOD debugger_controller->debug_step EXPORTING p_command = cl_tpda_script_debugger_ctrl=>debug_step_over. CATCH cx_tpda_scr_rtctrl_status . CATCH cx_tpda_scr_rtctrl . ENDTRY. 0.1. Then add the second element of the script logic: A debugger method call to read a variable that is to be checked. Here, we use a variable from the RFCSI structure returned by the special RFC call RFC_SYSTEM_INFO, which requires no logon. This is a convenient way to simulate the error that occurred at the customer site. Again, most of what we need is a debugger wizard call from the +Script Wizard+.
We need to add a variable declaration to receive the value read by the debugger. The type information for the declaration is given to us in the method signature inserted by the Wizard. Note that the names of variables in the debugged program must be in capital letters. DATA rfc_host TYPE pda_var_value. TRY. CALL METHOD cl_tpda_script_data_descr=>get_simple_value EXPORTING p_var_name = ‘SYSTEM_INFO-RFCHOST2’ RECEIVING p_var_value = rfc_host. CATCH cx_tpda_varname . CATCH cx_tpda_script_no_simple_type .ENDTRY. We might want to report exceptions with trace method calls after the CATCH instruction, for example if we wrote the variable name incorrectly in P_VAR_NAME. 0.1. The third element of the script is a little bit of logic to check whether SYSTEM_INFO-RFCHOST2 contains valid data. That might look like this: DATA length_of_hostname TYPE i. DATA target_destination TYPE rfcdest. DATA my_trace TYPE tpda_trace_custom. length_of_hostname = strlen( rfc_host ). IF length_of_hostname = 0 OR contains( val = rfc_host(length_of_hostname) regex = ‘[^[:word:]]’ ). We want to check that a hostname was returned and then that the hostname contains only the alphanumeric characters that we expect. By the way, the program DEMO_REGEX_TOY, featured in a weblog by Horst Keller, is a useful tool for testing your REGEX expressions. 0.1. The final element of the script is a trace message in the event that the script finds bad data returned by an RFC call. We could also insert an me->break( ) to stop at the scene of the crime as well.
We would want to add a second GET_SIMPLE_VALUE() call in order to report the name of the RFC destination, if we are not stopping to examine the situation directly. The user-specific trace message – written with method ADD_CUSTOM_INFO() requires only text in the VALUE field of the TPDA_TRACE_CUSTOM structure required by the method. TRY. CALL METHOD cl_tpda_script_data_descr=>get_simple_value EXPORTING p_var_name = ‘LS_ALSYSTEMS-DESTINAT’ RECEIVING p_var_value = target_destination. CONCATENATE ‘This destination returns bad data:’ target_destination INTO my_trace-value SEPARATED BY space. CALL METHOD trace->add_custom_info EXPORTING p_trace_entry = my_trace. CATCH cx_tpda_varname cx_tpda_script_no_simple_type. my_trace-value = ‘Error in script’. CALL METHOD trace->add_custom_info EXPORTING p_trace_entry = my_trace. ENDTRY. ENDIF. ENDMETHOD. “script 0.1. Save the script (remember to use a naming convention so that you can load the script easily). It is ready to use in the debugger. The output might look like this:
You can also download the script to file so that it is available for uploading into other systems, should RFC problems occur elsewhere. h3. Script-Writing Notes Here are some tips that may help you to create scripts more quickly and efficiently. h5. Short Dumps The ABAP debugger infrastructure intercepts fatal errors in debugger scripts. A short dump is reported as a message in the status line of the debugger and does not propagate to a full-fledged short dump. For example, the script coding: DATA my_quotient TYPE I. my_quotient = 1 / 0. …produces this message rather than a short dump.


No comments:
Post a Comment