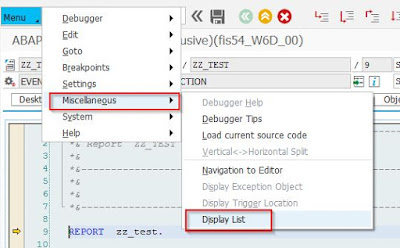
For a few years, I have been using the “new” ABAP-Debugger, and I’m quite happy with it (learning something new every other time, e.g. cool features for exploring memory usage or down- and uploading data (but only up to 500000 Lines) from/into internal tables).
Only recently I was missing a feature I knew I had used in the past: “Display List”.
Only recently I was missing a feature I knew I had used in the past: “Display List”.
When looking for that symbol in “new” ABAP-Debugger, I didn’t find it, so I was about to ask a question here at SAP Community.
I wanted to create a screenshot, but found out it’s not that easy getting into the classical debugger any more:
The switching option seems to be gone:
Looking at the settings, I found a nice read about the classic debugger:
In the last sentence I learned that the “new” debugger is now no longer called that, but “Standard Debugger” (That’s a good change of name, I think).
It still mentions the switching option, that is not there anymore. But it also gives an alternative:
/hset debugger=classic
(I used a different approach: just opening as many sessions as possible, gives you the classic debugger as well).
So, I got to the classic debugger, to take my screenshot;
Then I looked at the Standard Debugger again, to see if I really can’t spot a “Display List” option – guess what: I did:
An that’s why this text ended up not beeing a question, but a blog.
Happy debugging
Joachim
PS: Not sure if there’s a “Display List” option in AdT/Eclipse-Debugger?
Edit: Oh the switching option is still there, only burried deeper down:


No comments:
Post a Comment