Software Layer-Aware Debugging (SLAD) in NetWeaver 7.0 EHP2
The Problem…
Have you ever had this problem? You need to analyze a bug, or you want to find out how an application works. And you don’t know where exactly to set a breakpoint. So you start the ABAP Debugger and start stepping through the code.
And you keep on stepping through the code, endlessly, without reaching any of the application logic in which you are interested. ABAP applications often make use of application frameworks or technical infrastructures like ESI, Web Dynpro, or ALV. Finding your way through this infrastructure coding in the debugger to your own application coding can be time-consuming and inefficient.
… And The Solution
With NetWeaver 7.0 EHP2, which is delivered with Enhancement Package 5 of SAP ERP, ABAP brings you an elegant solution to the problem of reaching the code you want to debug: layer-aware debugging.
The basic idea of layer-aware debugging is simple: you separate the code in the system into the code that you want to debug and all the rest that you don’t want to see. You tell the New ABAP Debugger about this, and the debugger lets you jump right to the code you want to see, skipping over (optionally) all the rest of the code.
Here’s a short film demonstrating Layer-Aware Debugging:
You can define simple software layers either ad hoc, on the fly in the ABAP Debugger. Or you can define re-usable, more flexible layers as object sets in so-called SLAD profiles (Software Layer-Aware Debugging) in transaction SLAD.
You can vary software layers along these dimensions:
Granularity: You can define an object set broadly, as the list of software packages in a package component, for example. You can also define very narrow object sets, citing individual programs, classes, and function modules.
Visibility: You can specify in an object set whether code is visible in the debugger. You can also specify how the debugger should behave when it finds code from the object set – stop on entry, stop on exit.
Flexiblity: You can include multiple object sets in a profile, so you can modulate the behavior of the debugger with respect to software layers precisely. And a profile can specify what the debugger should do with all the rest of the code that is not defined in object sets.
Ad Hoc Layer-Aware Debugging
Here’s how you can use layer-aware debugging on the fly in the New ABAP Debugger. Our example is an ABAP Web Dynpro application. We want to skip all of the ABAP Web Dynpro code and jump right to the GRMG application code in package DSWP_MON_GRMG.
Here’s how to proceed:
1. Let’s assume that you do not know where to set a user breakpoint for external debugging to capture the Web Dynpro application. You can intercept the application using request-based debugging. Or you can use transaction SICF to have requests to the Web Dynpro application trigger the debugger. In either case, there is a lot of infrastructure code between your present location in the debugger and your own logic.
2. Once you are in the New ABAP Debugger, click on Configure Software Layer to define an ad hoc software layer. The debugger presents a screen in which you can do a direct definition of a layer (we’re doing this) or use a profile from transaction SLAD.
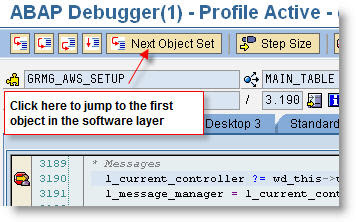
3. You’ll notice that Layer-Aware Debugging has added a new debugger control button, Next Object Set. Click on this button to tell the debugger to skip ahead to the start of the first object in the software layer.
The debugger responds by stopping at the start of the first object that it encounters in package DSWP_MON_GRMG.
4. If this is the right spot in the application logic, you can proceed with your debugging.
5. If there is still more non-layer code in the way, then you can continue to use Next Object Set to skip over the non-layer code. The debugger will stop when it re-enters an object of package DSWP_MON_GRMG after processing a call or set of calls to code from packages that are not in the layer.
Even if you knew in step 1 where to stop – where to set a user breakpoint for external debugging in order to capture the Web Dynpro application – layer-aware debugging can still be useful to you by letting you skip over extraneous coding.
Defining Re-Usable Software Layers in Transaction SLAD
Direct, ad hoc layer definitions in the debugger are convenient for a quick debugging session. But often you can save yourself time by defining re-usable layer-aware object sets and profiles in the SLAD-Cockpit, transaction SLAD (Software Layer-Aware Debugging).
Let’s say that it is your turn in support. With an SLAD profile, you do not need to enter a list of your packages in an ad-hoc software layer every time that you start the debugger. And only with an SLAD profile can you fine-tune the behavior of the debugger by referencing multiple object sets with differing visibility and debugger-behavior settings.
Here’s how to define object sets and profiles in transaction SLAD.
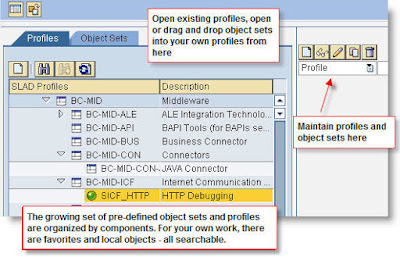
1. Start the SLAD-Cockpit by entering transaction SLAD in the Command field. Here’s what the desktop looks like.
2. Toggle the Object Type field from Profile to Object Set, and enter a name for a new object set. (You can also work top-down from a profile and create object sets via forward navigation, if you wish). When you press the Create button, you’re asked to describe the object set and assign it to a component.
3. Now you can specify the objects that belong to the object set.
4. An object set is there to define the objects that belong to a software layer. But an object set is actually made up of one or more Selection Sets. A selection set is where you actually identify the individual packages, classes, function modules or other objects that belong to an object set. Here, we have one selection set for the GRMG package itself, with any sub-packages. And we have a selection set for GRMG classes (classes in the GRMG package).
5. Complete the object set by specifying how the selection sets are logically linked. You can link object sets with AND, OR, or NOT logic.
Linking selection sets within object sets in this way lets you define elegant filters and conditions for jumping through the code in layer-aware debugging. But of course you can keep your object sets very simple as well.
6. To stop at any object in any of the selection sets, just link the selection sets with OR in the Linking of Selection Sets editor. In this example, pressing Next Object Set in the debugger would stop the debugger in any object in the GRMG package AND ALSO (OR logic) any class in the GRMG package (class name specification CL_GRMG* in the selection set). This is a nice way to see all of the class implementations in GRMG in their context in programs or function modules.
Alternatively, you could stop in layer-aware debugging only at GRMG classes with AND. Or stop at all components in the GRMG package EXCEPT GRMG classes with AND NOT linking.
7. Save the object set. The system asks you for a transport request for the object set – both object sets and profiles are ABAP Repository objects and therefore are transportable. You can transport setup work that you do in one system to other systems in your system landscape.
9. Create an SLAD profile. Toggle the Object Type field from Object Set to Profile, and enter a name for the new profile.
10. Once you have entered a description and – if applicable – the component to which the profile belongs, you can add object sets to the profile. Add object sets from the navigation pane on the left side of the screen – simply drag and drop objects sets into the profile pane.
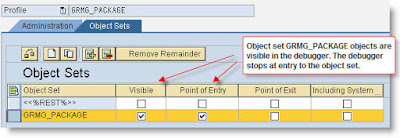
11. In the profile, you can specify the following for each object set:
- Whether the object set is visible in the debugger or not
- Whether system coding called by the objects in the object set should be visible in the debugger
- Whether the debugger should stop at entry to the first object it encounters in the layer, when the debugger leaves the layer, or not at all.
With the special object set <<%REST%>>, you can specify explicitly what the debugger should do with all of the code that DOES NOT belong to any of your object sets. Or with Remove Remainder, you can delete <<%REST%>> and let your objects sets determine how the debugger behaves. By default, <<%REST%>> code is not visible and is ignored by the debugger when layer-aware debugging is active.
Here, the debugger should stop at entry to the first object it encounters in the GRMG_PACKAGE object set (according to the selection set and OR logic, that was any object in the GRMG package and also any GRMG class (classname CL_GRMG*).
12. Save the profile. It is ready to use in the debugger.
As you may have seen above in ‘Ad Hoc Layer-Aware Debugging’, you turn on layer-aware debugging in the New ABAP Debugger by clicking on Configure Software Layer. You can then select your profile as the configuration for layer-aware debugging.
Notes: How to Find Out What to Include in a Software Layer
If you are really lucky, you know exactly where to set a breakpoint in order to debug a problem. In this case, you don’t need layer-aware debugging. You can stop in the debugger exactly at the logic you want to see.
If you kind of lucky, then you are working with your own code or code that belongs to your project. You probably know the packages and programs that contain your code. And you can define a software layer consisting of these entities. This kind of positive list of interesting code is optimal; a software layer defined this way lets you jump right to your code and also lets you skip over infrastructure code that may be intermingled in your code.
But what do you do if you really don’t know the software that you are about to debug? How can you find out what to include in a software layer that you define for layer-aware debugging? Maybe you can ask someone who knows. Perhaps you are working on a problem involving a customer’s development – then you can ask about the packages and other components that the customer uses.
But if you really are unlucky and do not even have a contact person who knows the code, here are two good ways to find out what to include in a ‘visible’ software layer:
- Use the ABAP Runtime Analysis (transaction SAT) to trace the processing blocks in all or part of an application. (See the online documentation on SAT).
- Use a simple pre-defined script in the New ABAP Debugger to trace all or part of the call hierarchy of a program in the debugger. (See the online help for debugger scripts).
The information in these traces lets you assign trace entries to software components pretty easily. You can then define a software layer on the basis of package assignments or the objects in the traces themselves. The traces may even show you exactly where to set a breakpoint.
Finding Packages with the SLAD Component to Development Package Mapping
If you know the component that you want to specify in a SLAD object set, then you can use the package select in the Object Set editor to find out which packages belong to the component. Here’s how to do this:
Starting from the Object Set editor, click on Display/Change Selection to open the package selector.
Drill down to the component whose code you want to filter out in the debugger. In this case, we go to the ABAP Web Dynpro Runtime component.
Double-Click on the component to see which packages are assigned to it.
Here, you can see that we can hide the infrastructure code of ABAP Web Dynpro by making all packages that begin with SWDP* invisible in the debugger.
Click on Adopt to move the packages that you mark to your object set.


No comments:
Post a Comment